vertex-wise, whole-brain linear mixed models
The goal of verywise is to offer a flexible, user-friendly interface to whole-brain analysis of neuro-imaging data that has been pre-processed using FreeSurfer.
The package was specifically designed for the analysis of longitudinal (e.g. multi-session) and/or multi-site neuroimaging data.
Currently, verywise allows the estimation of vertex-wise Linear Mixed Models, and meta-analysis, but will be extended to other statistical models in the future.
It can handle imputed (phenotype) data from several packages (mice, mi, amelia, etc.).
Multiple testing correction is currently achieved using MCZ simulations from FreeSurfer. This means that you will need FreeSurfer installed and correctly set up.
Installation
You can install the development version of verywise from GitHub with:
# install.packages("pak")
pak::pak("SereDef/verywise")

# or
# install.packages("devtools")
devtools::install_github("SereDef/verywise")
Basic use
There are many settings that benefit from the multilevel structure implemented in verywise
Run a linear mixed model (e.g. longitudinal analysis)
run_vw_lmm(
  formula = vw_thickness ~ sex * age + site + (1 | id), # model formula
  pheno = long_format_data, # An R object already in memory, or "path/to/phentype/data"
  subj_dir = "/path/to/freesurfer/subjects", # Neuro-imaging data location
  outp_dir = "/path/to/output", # Where you want to store results
  hemi = "lh", # (default) or "rh": which hemisphere to run
  n_cores = 4  # parallel processing
)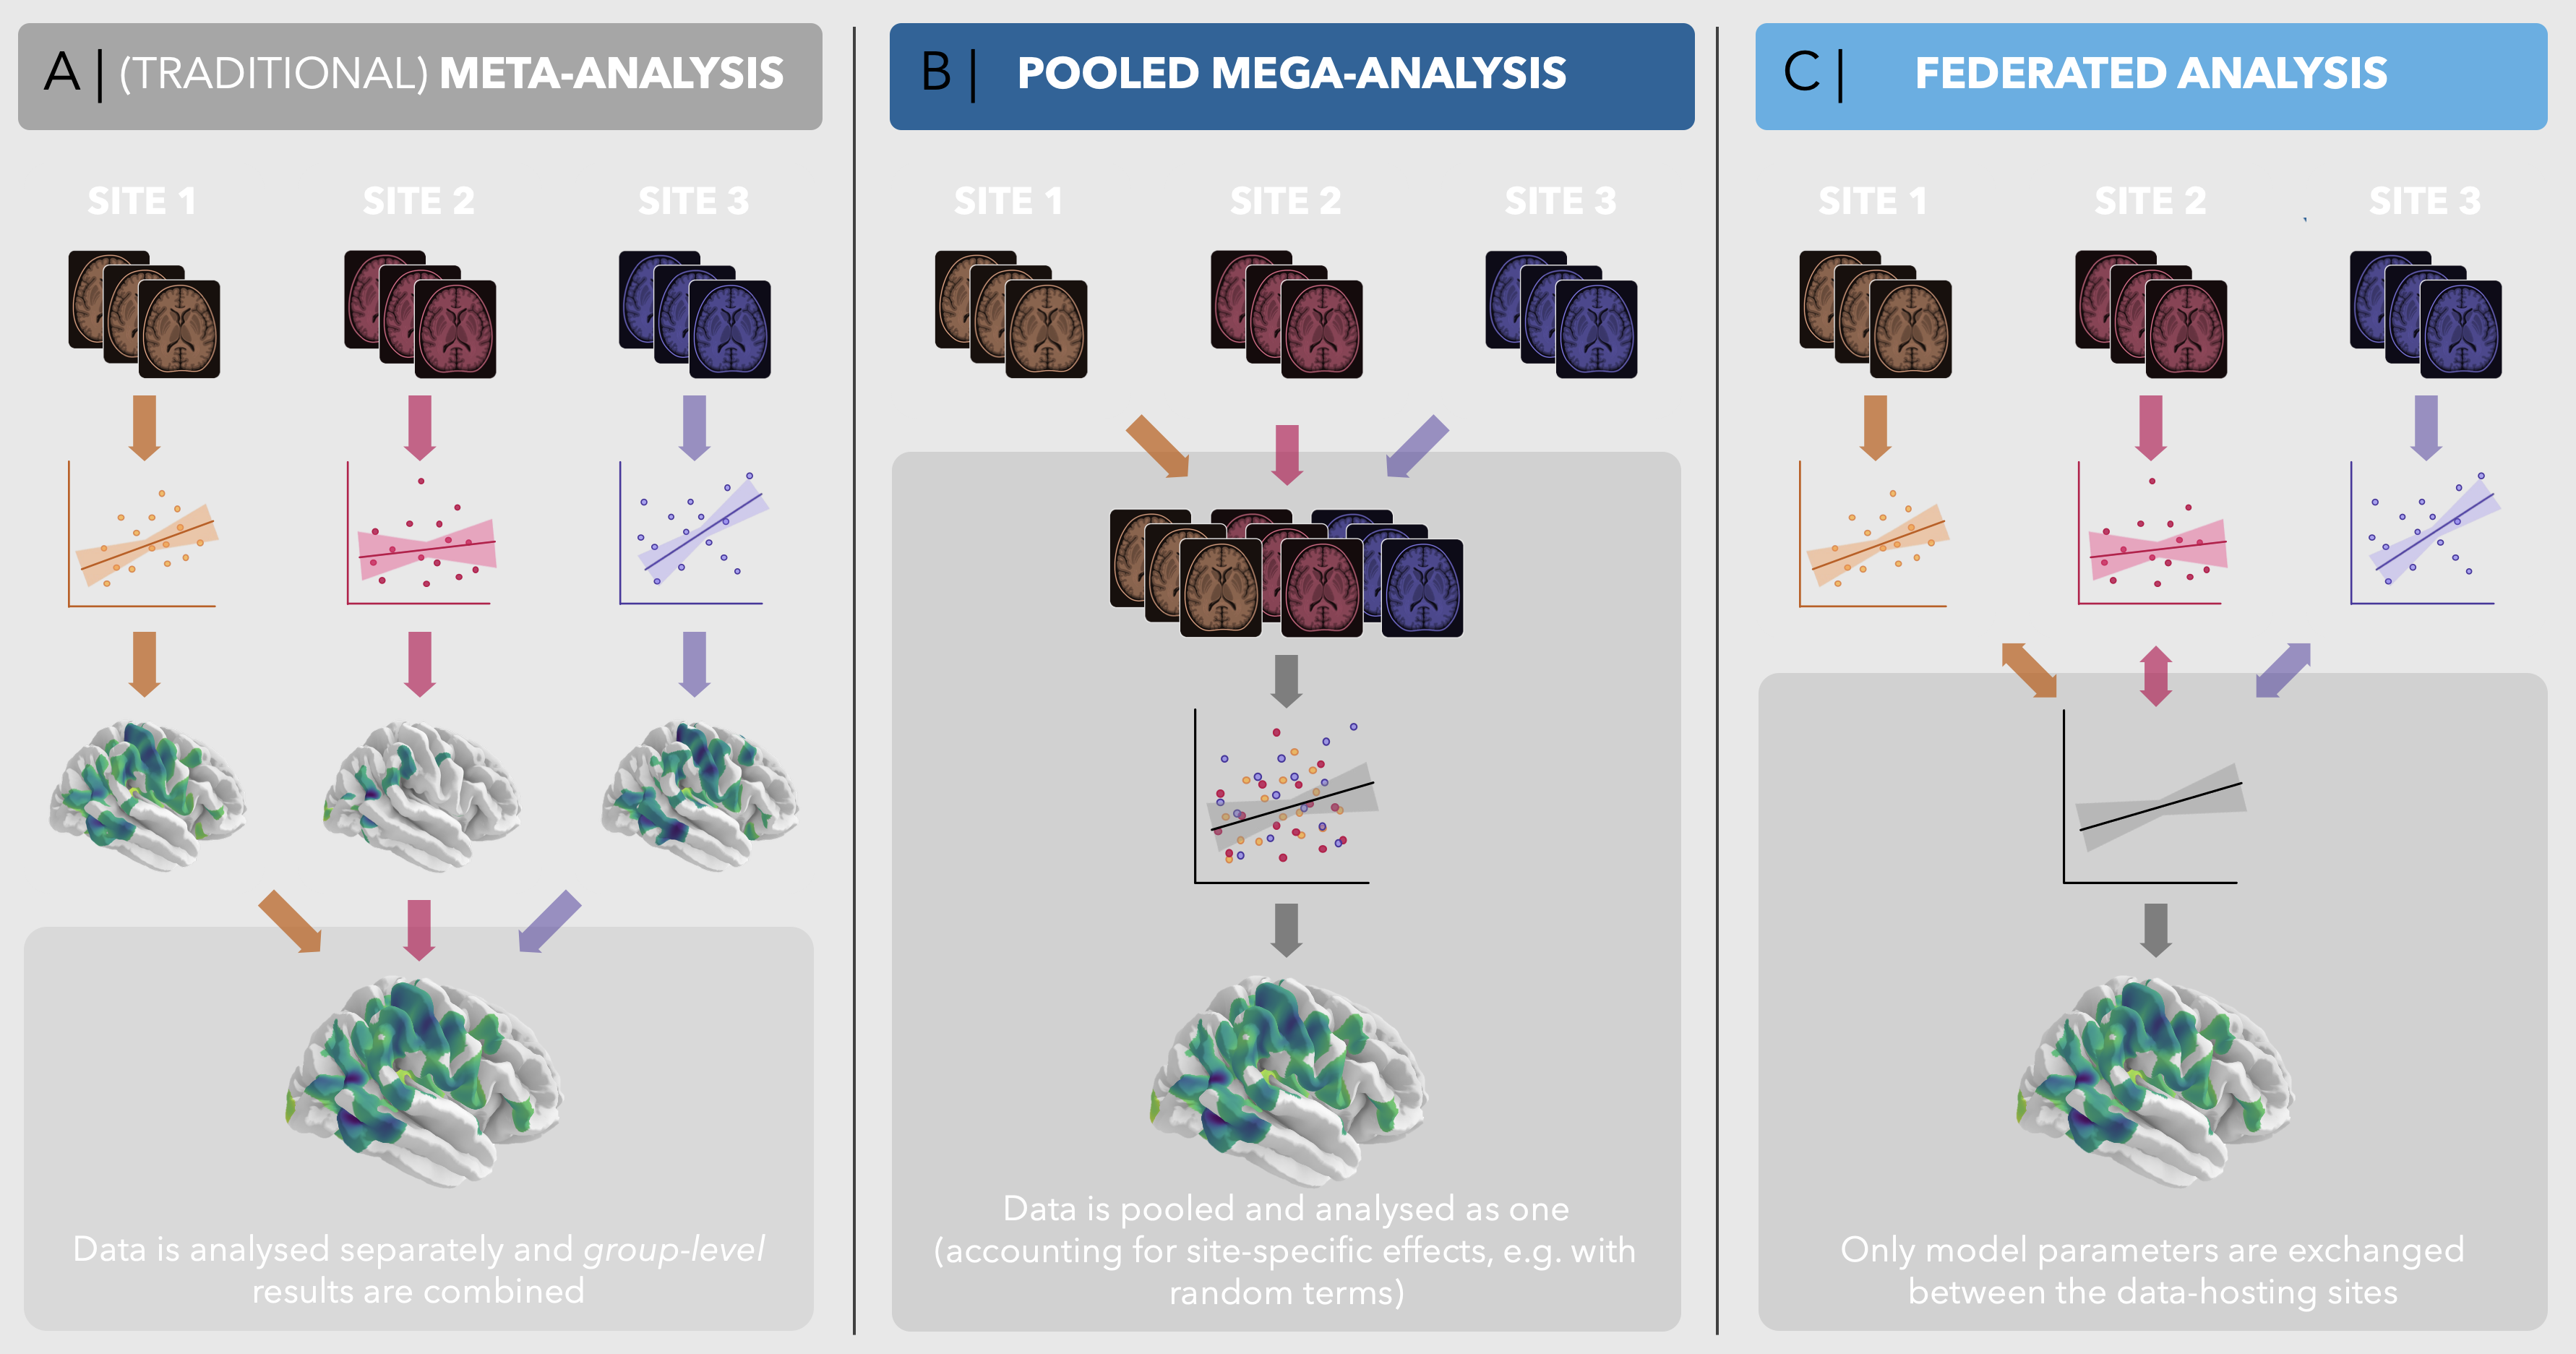
Run a (traditional) meta-analysis
run_vw_meta(
  term = "age", # Which "term" / predictor / effect to pool
  hemi = "lh", # (default) or "rh": which hemisphere to run
  measure = "area", # (default) or any available FreeSurfer metric.
  res_dirs = c("/path/to/study1/results", "/path/to/study2/results"),
  study_names = c("Study1", "Study2"),
  outp_dir = "path/to/meta/results",
  mtc = 'fdr', # multiple test correction (fdr or FreeSurfer MC cluster "fs")
  n_cores = 4  # parallel processing
)
Run a federated / distributed analysis
STEP 1: at each local site
s1_res = run_vw_fed_local(
  site_name = "site1",
  formula = vw_area ~ sex + age,
  pheno = pheno_site1,
  subj_dir = "/path/to/site1/local/data",
  outp_dir = "/path/to/site1/partial/results",
  hemi = "lh",
  fs_template = "fsaverage",
  n_cores = 1)

# [...] Run other models, e.g. rh, thickness... once done:
compress_local("/path/to/site1/partial/results", "site1")

# Send the "site1.tar.gz" the the aggregating center
STEP 2: at the aggregating center
tot_res <- run_vw_fed_aggr(
  site_names = c('site1', 'site2', 'site3'),
  formula = vw_area ~ sex + age,
  inpt_dir = "/path/to/tarred/partial/results",
  outp_dir = "/path/to/final/results",
  hemi = "lh",
  fs_template = "fsaverage"
  n_cores = 1)
Note: verywise implements a lossless algorithm (i.e. tot_res identical to running the model on the entire dataset, as on mega-analysis, but privacy preserving).
Visualization
To inspect and plot your results, you can use our interactive web application, verywiseWIZard. You can run this locally or try it out here.
Plots can also be generated using verywise like so:
# Plot result brain map (reticulate for interface with Python-based plotting libraries)
plot_vw_map(
  res_dir = "/path/to/output",
  term = "age",
  measure = 'area',
  hemi = "both", # or single "lh", "rh"
  surface = "pial", # or "inflated"
  threshold = 'cws', # cluster-wise significant, or e.g. "fdr<0.05"
  to_file = NULL, # interactive visualization, or set to "path/to/figure.png" for static output
  # optional argument
  fs_template = "fsaverage",
  fs_home = "/path/to/FREESURFER_HOME", # quicker: use local maps
)
See also plot_vw_surf() for additional arguments and plot_vw_diff() for quickly plotting vertex-wise differences between two brain maps.
Tutorials and documentation
You can find more info and extended tutorials on the package website. For example:
License and credits
verywise is open-source and free to use under the Apache-2.0. license.
This is a spin-off of the QDECR package, which handles linear regression models.
Contributing
If you spot a bug or you have a question, please let us know on the GitHub issues page.
We are always happy to get suggestions, ideas and help!
Funders

This work was supported by the FLAG-ERA grant Infant2Adult and by The Netherlands Organization for Health Research and Development (ZonMw, grant number 16080606).